 Every Operations Manager Should Track")
Key Performance Indicators (KPIs) Every Operations Manager Should Track
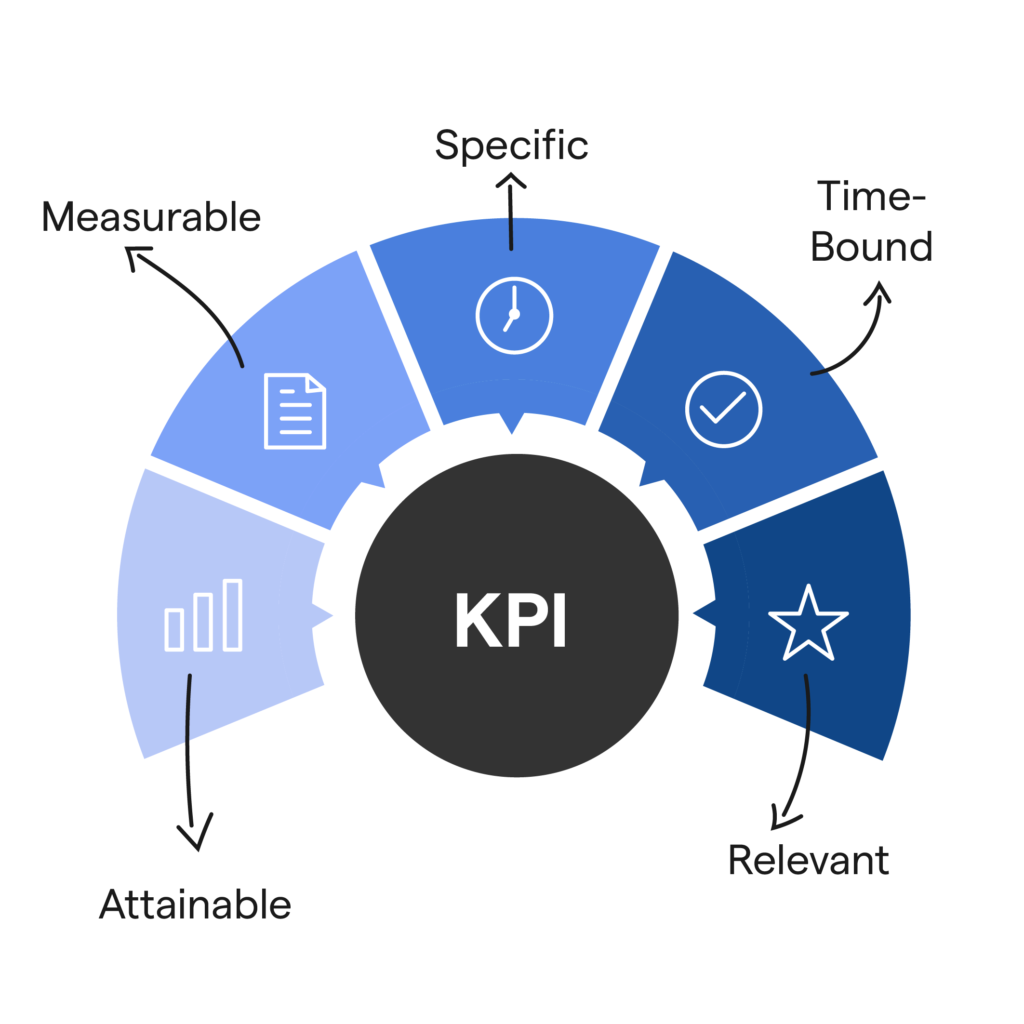
Operations management is all about ensuring that business processes run efficiently, consistently, and profitably. But without clear metrics, even the most experienced operations manager is essentially guessing. That’s where Key Performance Indicators (KPIs) come in.
Table Of Content
- Why KPIs Matter in Operations Management
- Key benefits include
- 1. Overall Equipment Effectiveness (OEE)
- It measures
- Why it matters
- Formula
- 2. Cycle Time
- Includes
- Why it matters
- 3. Throughput
- Examples
- Why it matters
- 4. Capacity Utilization
- Formula
- Why it matters
- 5. First Pass Yield (FPY)
- Why it matters
- 6. Inventory Turnover
- Formula
- Why it matters
- 7. Order Fulfillment Time
- Includes
- Why it matters
- 8. Cost per Unit
- Why it matters
- 9. Downtime (Planned vs Unplanned)
- Types
- Why it matters
- 10. On-Time Delivery Rate
- Why it matters
- 11. Employee Productivity
- Examples
- Why it matters
- 12. Customer Complaint Rate
- Why it matters
- 13. Return Rate
- Why it matters
- 14. Process Efficiency
- Why it matters
- 15. Net Promoter Score (NPS)
- Categories
- Why it matters
- How AI Is Changing KPI Tracking in 2026
- Key improvements include
- Choosing the Right KPIs for Your Business
- Consider
- Best practice
- Common KPI Tracking Mistakes
- 1. Tracking too many KPIs
- 2. Ignoring context
- 3. Not acting on insights
- 4. Using outdated data
- Final Thoughts
KPIs provide measurable insights into performance, helping managers identify bottlenecks, improve productivity, reduce costs, and enhance overall business performance. In 2026, with AI-driven analytics and automation becoming standard, tracking the right KPIs is more important than ever.
This guide breaks down the most essential KPIs every operations manager should track to maintain control, improve efficiency, and drive strategic growth.
Why KPIs Matter in Operations Management
KPIs act as a bridge between strategy and execution. They turn abstract goals into measurable outcomes.
Key benefits include:
- Improved decision-making
- Better resource allocation
- Early detection of inefficiencies
- Increased accountability
- Higher operational efficiency
- Data-driven performance optimization
Without KPIs, operations teams lack direction and visibility.
1. Overall Equipment Effectiveness (OEE)
OEE is one of the most important manufacturing and production KPIs.
It measures:
- Availability (uptime vs downtime)
- Performance (speed vs ideal speed)
- Quality (good units vs defective units)
Why it matters:
OEE shows how efficiently equipment is being used.
Formula:
OEE = Availability × Performance × Quality
A high OEE indicates strong operational efficiency.
2. Cycle Time
Cycle time measures how long it takes to complete a process from start to finish.
Includes:
- Production cycles
- Order fulfillment
- Service delivery
Why it matters:
Shorter cycle times mean faster operations and improved customer satisfaction.
Reducing cycle time often leads to higher throughput and lower costs.
3. Throughput
Throughput measures how many units or tasks are completed within a specific timeframe.
Examples:
- Products manufactured per hour
- Orders processed per day
- Tickets resolved per shift
Why it matters:
Higher throughput indicates improved productivity and efficiency.
4. Capacity Utilization
This KPI measures how much of available capacity is actually being used.
Formula:
Capacity Utilization = (Actual Output / Maximum Possible Output) × 100
Why it matters:
- Identifies underused resources
- Helps optimize production planning
- Prevents overloading systems
5. First Pass Yield (FPY)
FPY measures the percentage of products or outputs that are completed correctly the first time without rework.
Why it matters:
- Indicates process quality
- Reduces waste and rework costs
- Improves efficiency
A high FPY reflects strong process control.
6. Inventory Turnover
Inventory turnover measures how quickly inventory is sold and replaced.
Formula:
Inventory Turnover = Cost of Goods Sold / Average Inventory
Why it matters:
- Prevents overstocking
- Reduces storage costs
- Improves cash flow
Low turnover may indicate inefficiency or weak demand.
7. Order Fulfillment Time
This KPI tracks the total time from receiving an order to delivering it to the customer.
Includes:
- Order processing
- Packaging
- Shipping
Why it matters:
Faster fulfillment improves customer satisfaction and retention.
8. Cost per Unit
Cost per unit measures how much it costs to produce one unit of product or service.
Why it matters:
- Helps control production costs
- Identifies inefficiencies
- Supports pricing strategy
Reducing cost per unit improves profitability.
9. Downtime (Planned vs Unplanned)
Downtime measures periods when operations are halted.
Types:
- Planned downtime (maintenance, upgrades)
- Unplanned downtime (breakdowns, failures)
Why it matters:
Excessive unplanned downtime reduces productivity and increases costs.
10. On-Time Delivery Rate
This KPI measures the percentage of orders or tasks delivered on schedule.
Why it matters:
- Impacts customer satisfaction
- Reflects operational reliability
- Influences brand reputation
A high on-time delivery rate indicates strong operational control.
11. Employee Productivity
Employee productivity measures output per employee or team.
Examples:
- Tasks completed per employee
- Revenue per employee
- Units produced per worker
Why it matters:
Helps identify training needs and optimize workforce allocation.
12. Customer Complaint Rate
This KPI tracks the number of complaints received over a given period.
Why it matters:
- Identifies quality issues
- Highlights process failures
- Impacts customer satisfaction
A rising complaint rate signals operational problems.
13. Return Rate
Return rate measures how often customers return products.
Why it matters:
- Indicates product quality issues
- Impacts revenue and logistics costs
- Helps improve product design and quality control
14. Process Efficiency
Process efficiency evaluates how effectively resources are used in operations.
Why it matters:
- Identifies waste
- Improves workflow design
- Enhances productivity
AI-powered analytics tools are increasingly used to optimize this KPI in 2026.
15. Net Promoter Score (NPS)
NPS measures customer satisfaction and loyalty based on how likely customers are to recommend your business.
Categories:
- Promoters
- Passives
- Detractors
Why it matters:
A strong NPS reflects operational excellence and customer satisfaction.
How AI Is Changing KPI Tracking in 2026
AI has transformed how KPIs are monitored and analyzed.
Key improvements include:
- Real-time dashboards
- Predictive KPI forecasting
- Automated anomaly detection
- Intelligent alerts for performance drops
- Cross-functional KPI integration
This allows managers to shift from reactive reporting to proactive optimization.
Choosing the Right KPIs for Your Business
Not all KPIs are equally important for every organization.
Consider:
- Industry type
- Business size
- Operational complexity
- Strategic goals
Best practice:
Focus on a small set of high-impact KPIs rather than tracking everything.
Common KPI Tracking Mistakes
1. Tracking too many KPIs
Leads to confusion and lack of focus.
2. Ignoring context
Numbers without context can be misleading.
3. Not acting on insights
KPIs are useless without action.
4. Using outdated data
Delayed insights reduce effectiveness.
Final Thoughts
KPIs are the foundation of effective operations management. They transform raw data into actionable insights that drive performance, efficiency, and growth.
In 2026, with AI-powered analytics becoming standard, KPI tracking is more dynamic and intelligent than ever. However, technology alone is not enough—successful operations managers must still apply strategic thinking to interpret data and make informed decisions.
By focusing on the right KPIs, businesses can optimize processes, reduce costs, improve quality, and deliver better customer experiences.
Ultimately, what gets measured gets improved—and KPIs are the key to continuous operational excellence.
 Every Operations Manager Should Track")
 Every Operations Manager Should Track")


